Overview
Information and order is a principle of design based on categorization, viewing ease, and visual clarity with very few words. The overarching concept of this practice is to organize data, the building block for all design work. In Principles One: Information and Order, we analyzed materials according to the LATCH principle developed by Richard Saul Wurman, which stands for:
- Location
- Alphabetization
- Time/Chronology
- Category/Subsets
- Hierarchy
These ideas help create pathways between objects which previously may not have had clear connections. We went through many iterations and different concepts, some leading us to ideas we did not like and some leading us to new modes of thought and angles of sight. Overall, I enjoyed the ability to work with my hands and discover through connection and activities. However, I would like to have been told what was expected of us from the beginning of a class in more detail; I thought we needed a finished and polished presentation and all we were able to present was an exploration.
https://uxplanet.org/design-principle-organizing-information-343a7ef936a8
http://www.fontichiaro.com/activelearning/2012/10/25/applying-l-a-t-c-h-to-infographics/
The Objective:
The objective of this exercise was to explore the hidden connections between objects, some going deep beneath the surface, and to compile this out-of-the-box thinking in an informative and clear presentation.
Classwork
Initial Organization


The group laying the contents of our bags on the table and beginning to sort by shape and color.
Two Groups


The group of circles.


The group of entirely black items, which evolved later into a group of black rectangles.
An Experiment in Circles (and how they can become rectangles)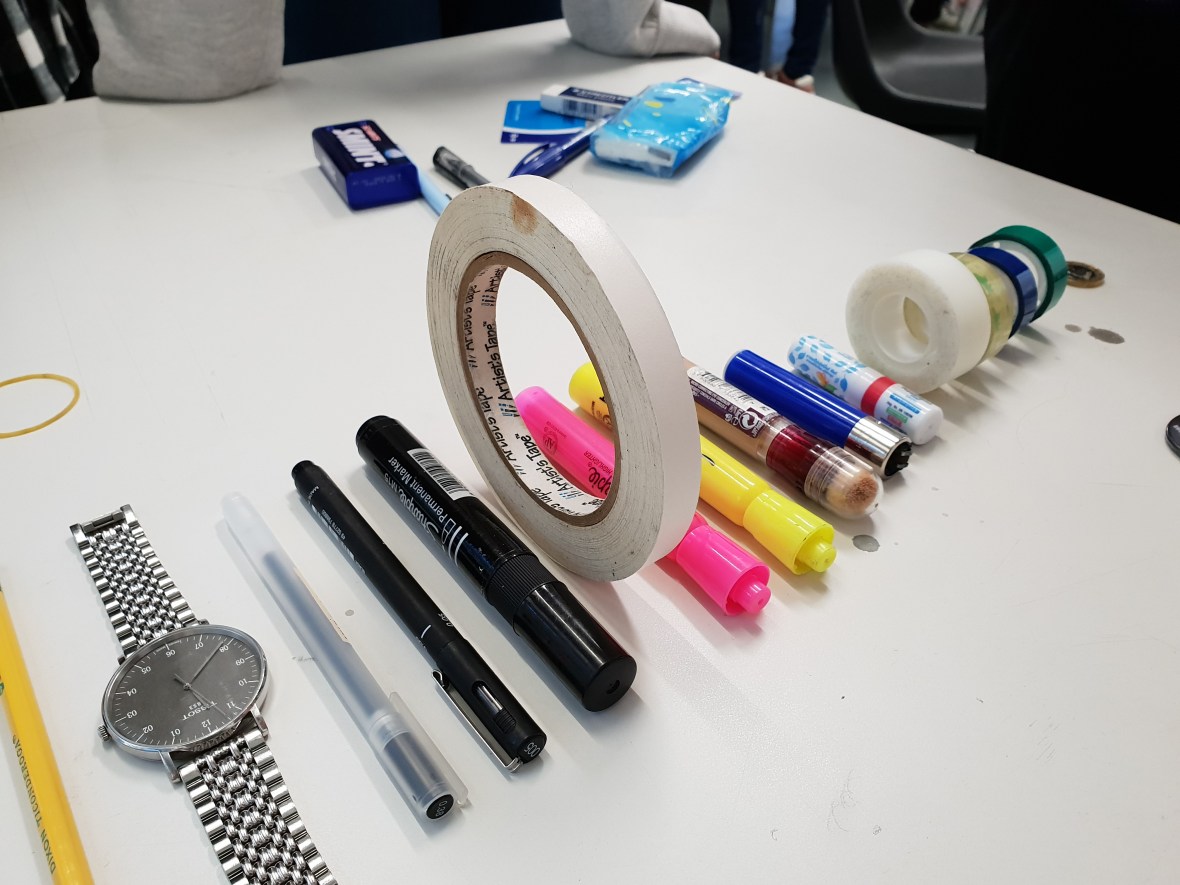


Setting up the circle group and organizing them by diameter. Some of these circles can be seen as rectangles from above, and the markers and pens are circular on their sides, but are also rectangular from above.
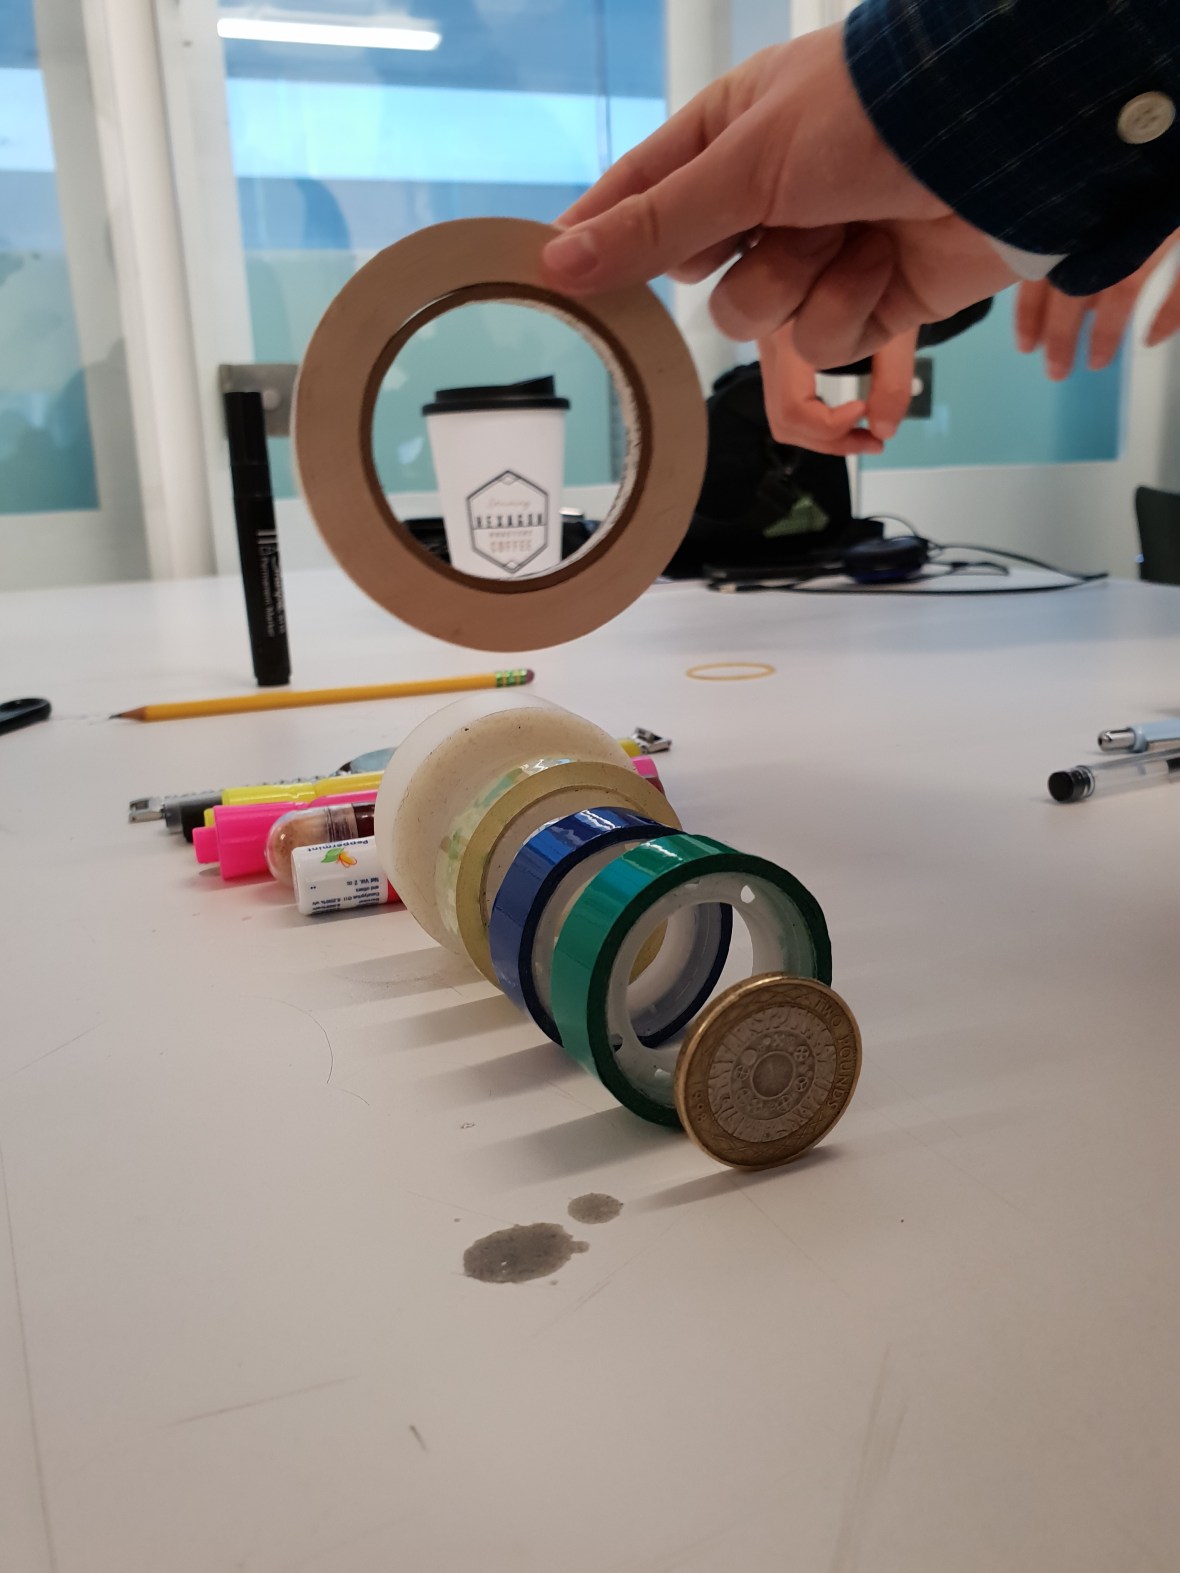
Experimenting with shadow length in an effort to classify the circles in an unusual hierarchy.


Revising and editing the line of circles, seen as rectangles from above.
Bottles
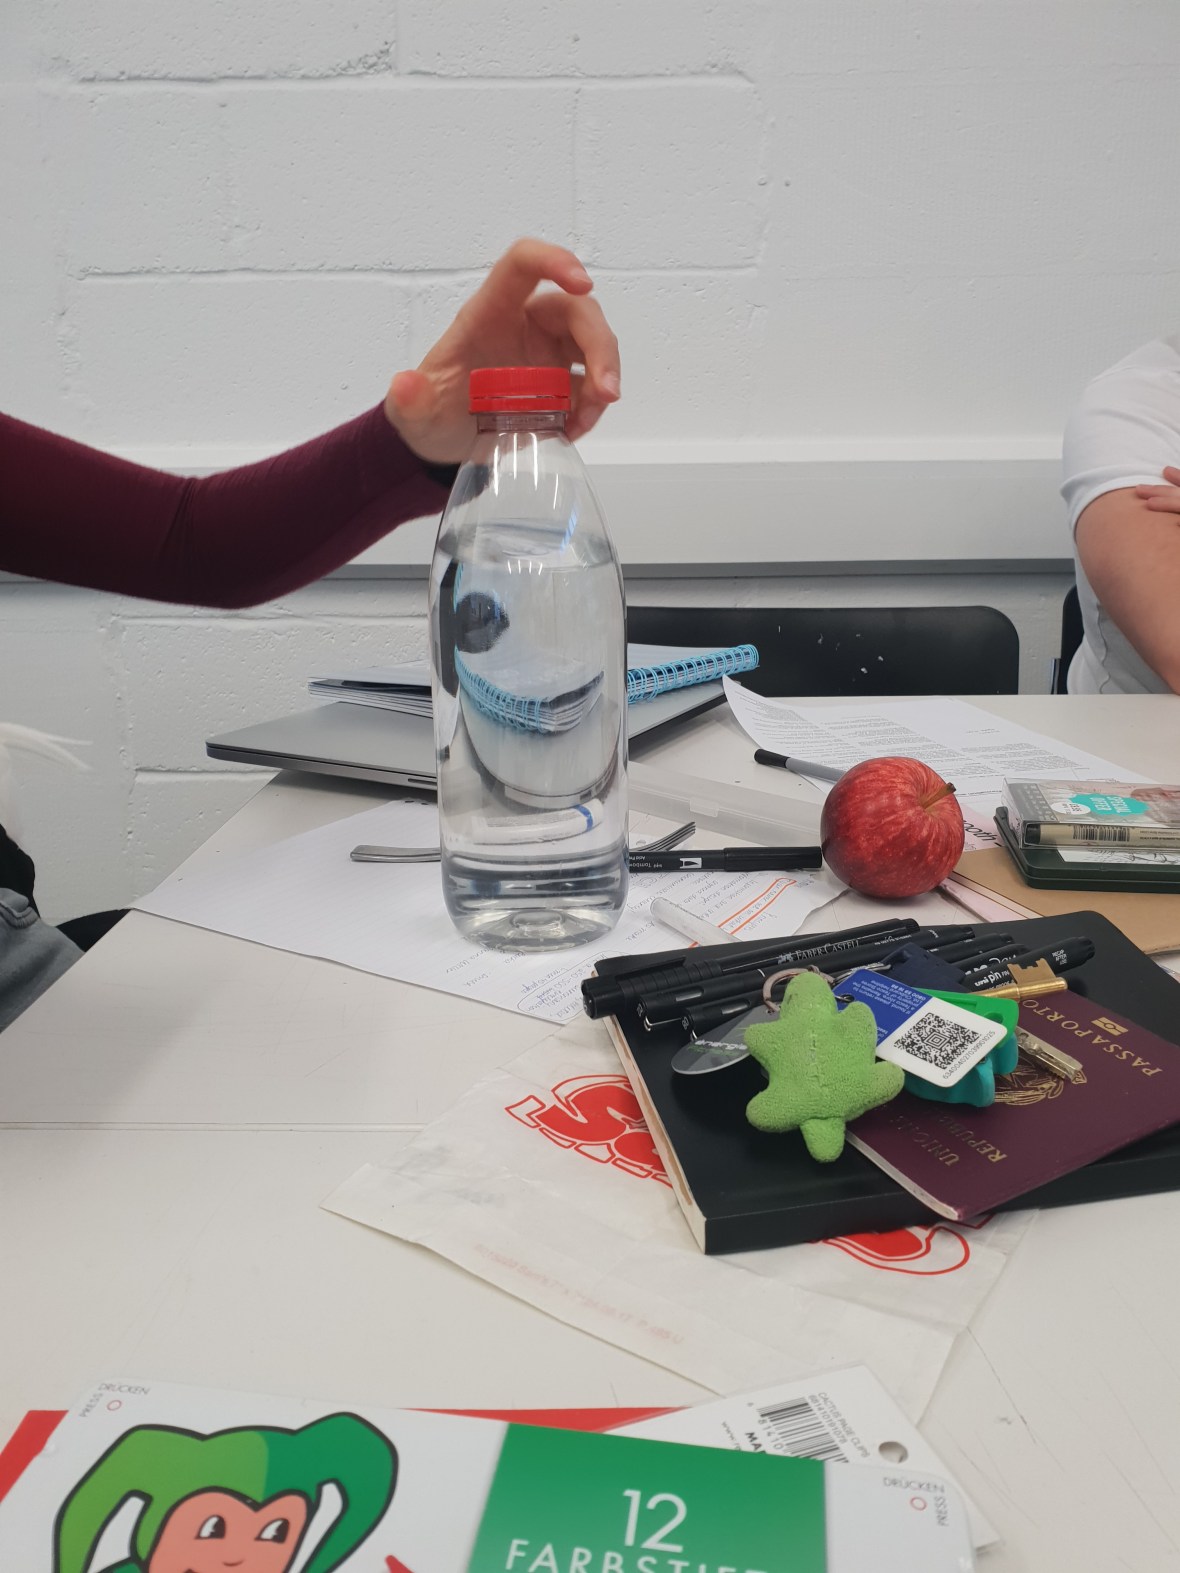
A brief exploration of distortions through bottles
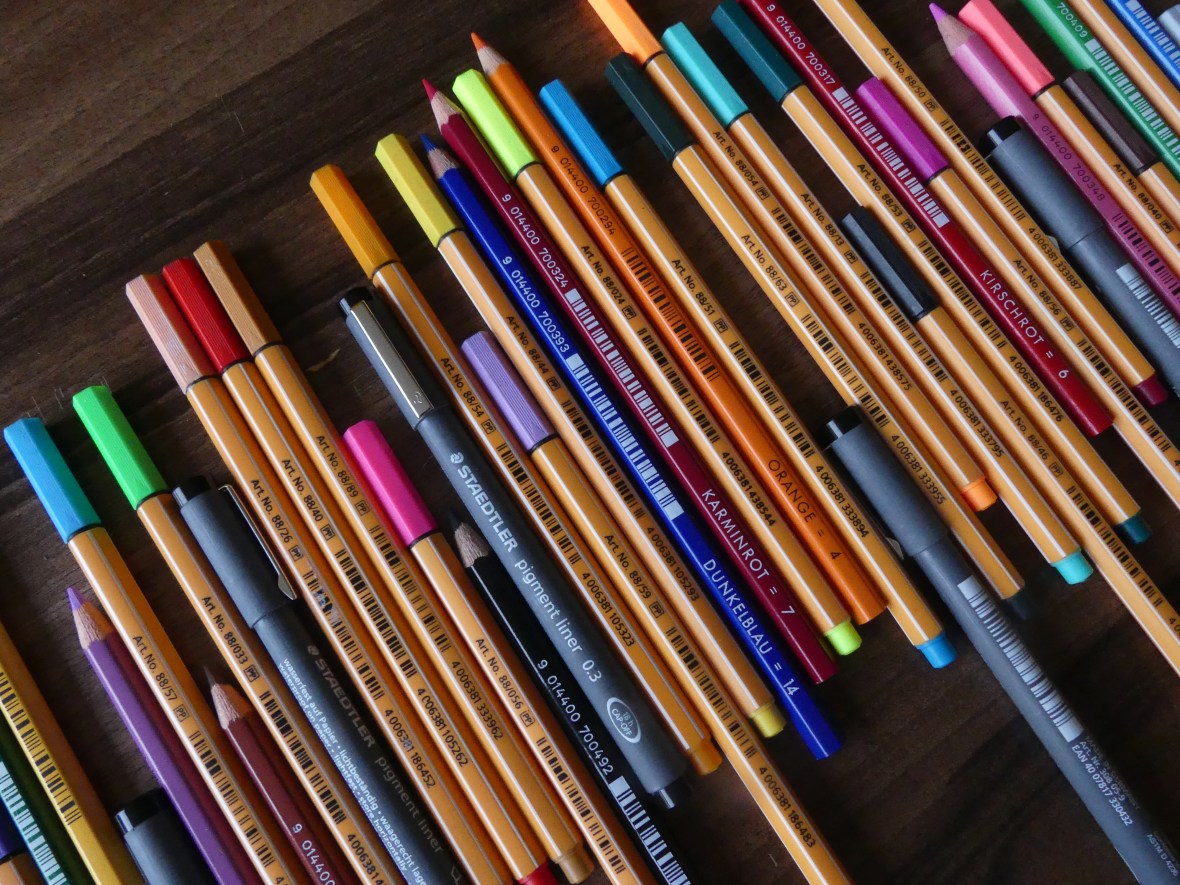
Barcodes
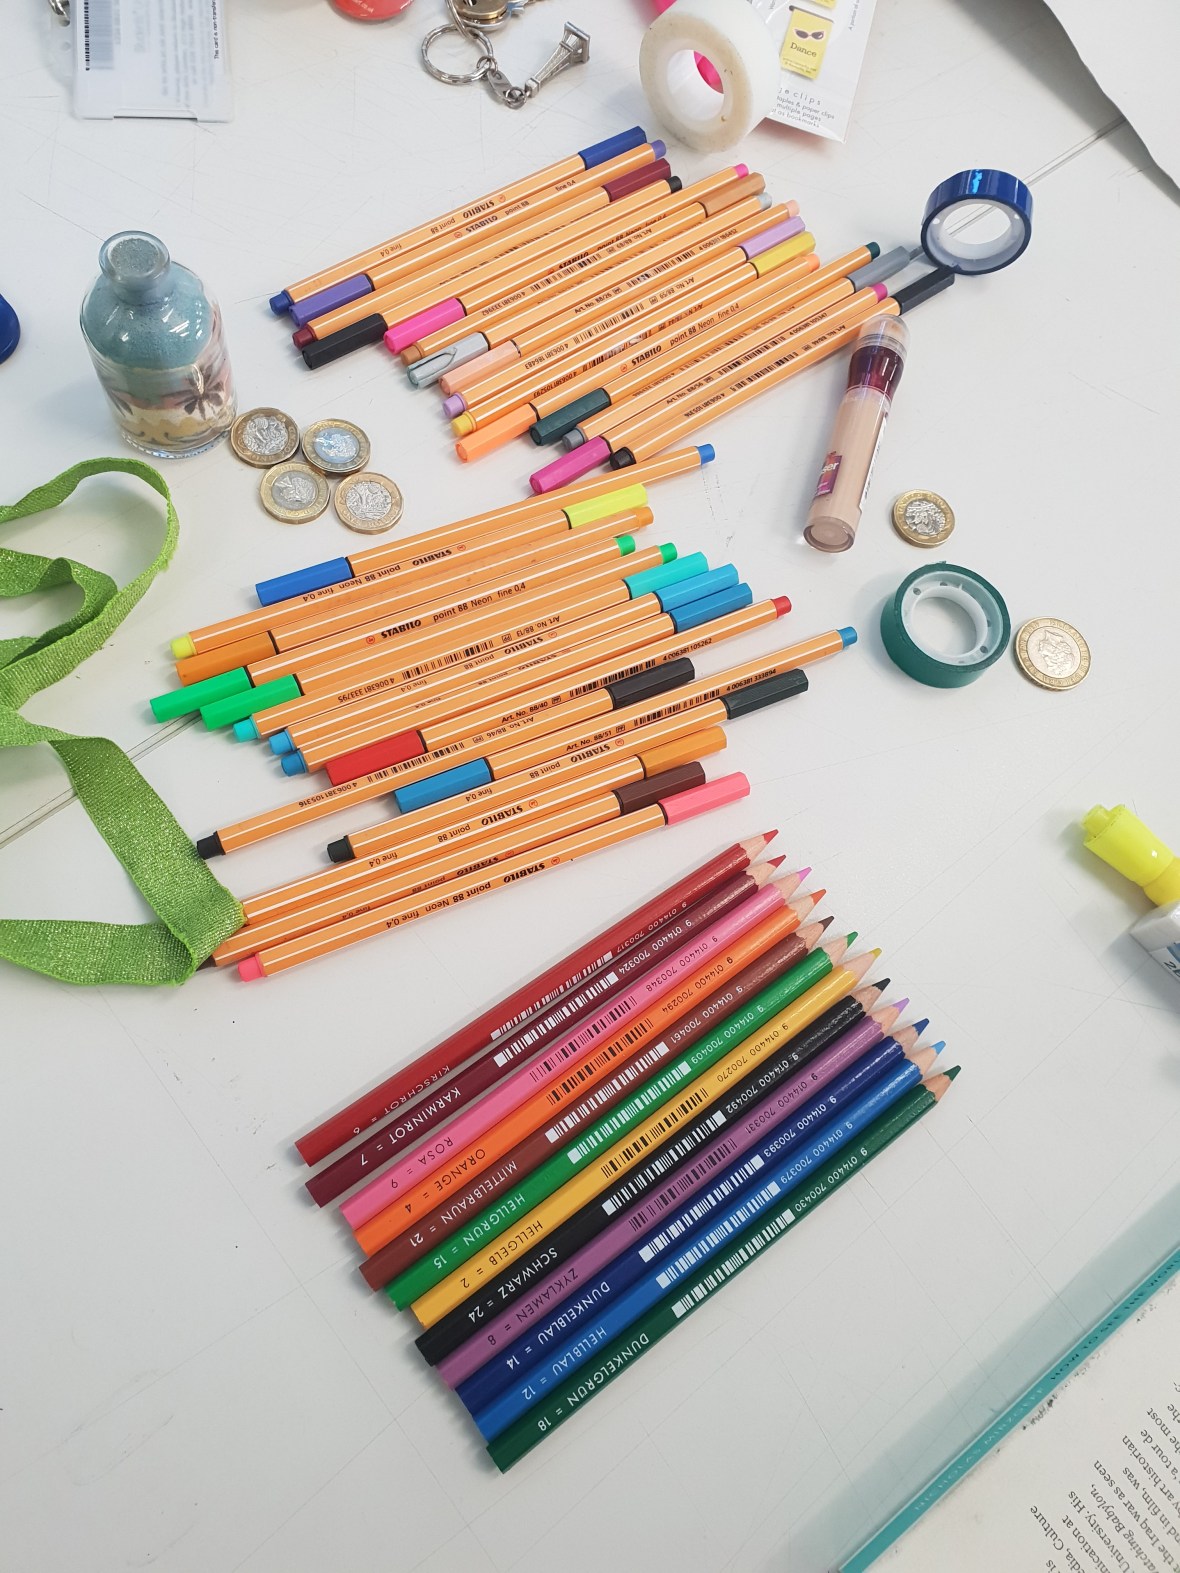
A brief exploration of pen and pencil bar codes with the idea of ordering them from smallest to largest number.
In My Pocket: An Exploration of Everyday Objects By Age


The final objects
Link to the final in-class presentation (compilation and last slide by Violet):
Hex: The Artist’s DNA
Idea
The idea of this project was to create the artist’s genome, based on the gel-separation of the different DNA components used in biology. The chart is organized by the last digit of the barcode number from lowest to highest; if two writing utensils had the same number, the number before that one would determine its position. This is the entirety of the artist’s DNA. However, once the user slides out the panels, the full four-letter spectrum is shown, Guanine, Adenine, Thymine, and Cytosine, and the entire graphic also becomes ordered by color class in the style of a genome test. Thus it is organized by both category and hierarchy in an interactive and cross-disciplinary format.
Research
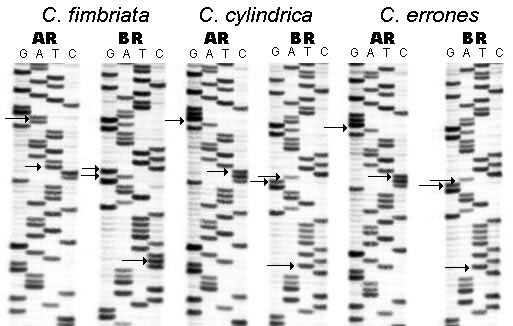
DNA sequencing
https://www.floridamuseum.ufl.edu/cowries/sequence2.html
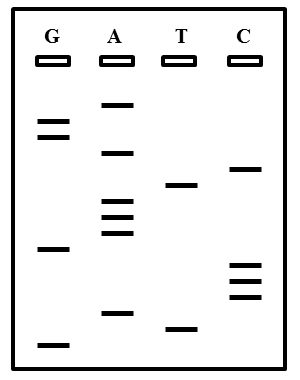
Sanger Process DNA genome sequencing
http://libros.ccd.ec/wp-content/themes/book-landing-page/languages/01-2010.ap-government_3733.php
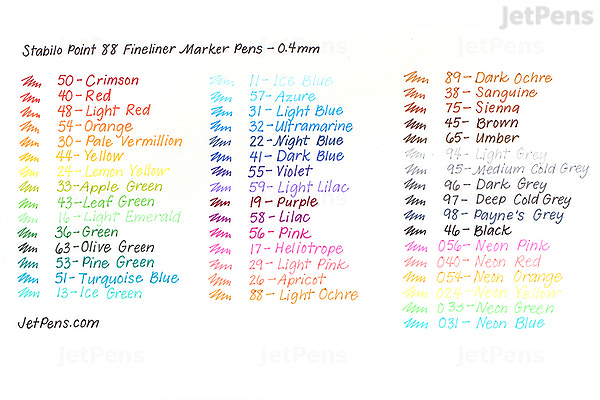
Specific names and colors of Stabilo Pens used in the exploration
https://www.jetpens.com/Stabilo-Point-88-Fineliner-Marker-Pen-0.4-mm-47-Color-Bundle/pd/16083
Experimentation


This particular idea went from bar codes to one line of a DNA-like structure, to the four lines of the Sanger method, resulting in an infographic of pens organized by color and number.
The First Stages of the Idea


The Artist’s Genome: Original and Digital (From Left to Right Ordered According to GATC)
Hex: The Artist’s DNA

The full Artist’s Genome

The final mockup of how the 3D final will be constructed.
Checkerboard background from https://pixabay.com/en/background-black-board-checker-20253/
